Whether you care about baseball or not. Whether you wanted to hear about it or not. If you’ve had more than three conversations with me in real life, I have told you that one of my favorite things is the fact that in baseball a player’s “Wins Above Replacement” (WAR) can be calculated. Statisticians can say, with a fairly high level of precision, how valuable (in terms of wins) a particular player is to a baseball team over a season. Imagine being able to calculate your colleagues value to the organization with math!
One of the problems with WAR though, is that it does not translate cleanly to fantasy baseball. There’s definitely a correlation between WAR and fantasy value, but it is far from perfect. So, this season, in preparation for my Fantasy Baseball draft, I set out to calculate how valuable all the potential players in Fantasy Baseball were. Settle in, this post is going to be long and worth it. I’ll start with a really quick overview of WAR in real baseball, then discuss the major sections of it that I had to change for fantasy baseball, finally I’ll talk about how the results were somewhat surprising.
WAR in “Real” Baseball.
At a high level, to calculate a player’s WAR we figure out the number of runs a player can be expected to add to a team with his bat/base running and the runs that he can prevent with his glove or pitching arm. We then divide that number by an approximation of the number of runs that it takes to win a game. Finally, we subtract the number of wins that a “replacement” player could have achieved. This is done by looking at the runs contributed/saved by the best player who would typically be available on waivers at that position.
Projection Systems
In order to calculate a players value for this upcoming season, we will need to get a reasonable guess of how they’ll do statistically in 2019. There are a lot of projection services, but I will be using Steamer because I can get it for free on Fangraphs. Steamer doesn’t post their exact algorithm, but I suspect that like most systems, they project a player’s statistics by assuming they will progress in a similar manner to historical players who had similar statistics at their age. So, for example, if you want to figure out how Andrew McCutchen will do this year. You look for players that have had similar careers to this point (if you’re curious… Andre Dawson, Dave Winfield, and Vernon Wells are the most similar) and then assume McCutchen’s age 32 season will be similar to what theirs was. Interestingly, Steamer was developed by a High School math teacher and two of his students in 2008 and has consistently been as accurate or more accurate than systems developed by high profile sports shops that charge for the data (ESPN, Baseball Prospectus).
Calculating “Wins” in Fantasy Baseball
If we’re going to calculate Fantasy WAR, the first thing we have to do is determine what a “win” is. Clearly, in fantasy baseball, runs scored and runs prevented don’t win games. In my fantasy baseball format, you play head to head each week against another player, but there isn’t just one winner. You effectively play 6 offensive games each week against one opponent, one for each statistical category (TB, HR, R, RBI, SB, OBP). For example, if my team has more home runs, total bases, and RBI but my opponents team has more stolen bases, runs, and a higher OBP than we each win three “games”. It’s those wins that matter at the end of the season for playoff seeding. For this reason, the “wins” that I’m counting is winning a single statistical category.
The next question is, how do I take a players projected home runs for the season and turn it in to fantasy wins in the home run category. What I need for that, is to be able to compare the player’s numbers to the average number of home runs a fantasy team will have per game in 2019. In my league their are a total of 120 players playing in each game (there are 12 teams and each team has 10 starting position players). It’s reasonable to assume that the 120 players playing will be the top 120 players according to fantasy drafts that have already been held in 2019 (this data is available in the Fangraphs data). I averaged the projected home runs that will be hit by those 120 players over the season. Since there are ~25 weeks in the season, I divided that number by 25 to get the average number of home runs per player per game in my league. I then assumed that a “win” in Home Runs can be achieved by beating one team (10 players) of those average players. For my league that means that 22.364 home runs is a “win” in home runs.
Calculating “Replacement” in Fantasy Baseball
In addition to knowing how many wins a player is worth, I also have to figure out how many wins a replacement player is worth. My league has 6 bench spots and 2 DL spots; I have assumed that teams will, on average, use half of those for position players. As I mentioned above, there are 12 teams in my league and 10 position player starters. That means that at any moment each team has spoken for 14 position players and the league has spoken for 168 total. Using that information, I have assumed that an available “replacement” player for fantasy purposes is the 169th best position player in any particular statistical category. So, for example, in HRs, the 169th best available player is Roland Guzman of the Rangers who is projected to hit 13 HRs (or .520 HR per fantasy baseball game).
Example of How it Comes Together to Get Fantasy WAR
Let’s take a look at Gincarlo Stanton’s WAR for just HRs. He is projected by Steamer to lead baseball with 45 HRs. As you saw above in the section on calculating replacement value, our replacement home run hitter is Roland Guzman and he will hit 13 HRs. Gincarlo can then be projected to hit 32 HRs above replacement. In the section on “Calculating Wins” we learned that 22.364 HRs should be enough to win the average game in my league. That means that Gincarlo is worth 32 HRs are worth an extra 1.43 wins for whatever team has him.
Comparing The Results to Average Draft Position
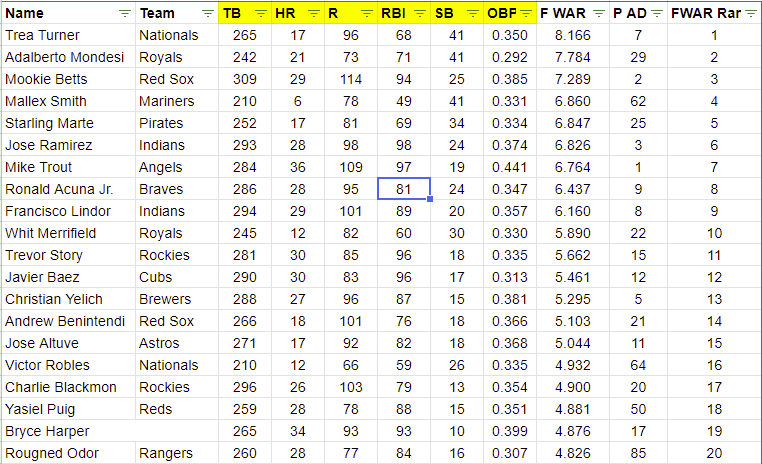
If you’re the curious type and have made it this far, you can find my calculations here. I have pasted the top 20 players by Fantasy WAR above. The column “P ADP” indicates what order they are selected in during Fantasy Drafts that have already happened this year. There are a few things that jump off the page:
- Stolen Bases are important. You’ll notice that no one whose projected to get less than 10 stolen bases even made the top 20 and that virtually all of the speedsters are towards the top. The reason this is true is because of how top-heavy the stolen base category is. It only takes 7 stolen bases to win a typical week, so Trea Turner’s 41 steals project to be worth almost 6 wins over the course of a season. Remember Giancarlo Stanton’s 45 HRs were only worth 1.43 wins because it would take 22 HRs to win a game. Be careful with this information though (see deficiency #3 below).
- Steamer likes a few of these guys better than people drafting leagues seem to. Roughned Odor and Yasiel Puig in particular show up as much more valuable than you’d expect (most of the rest of the big differences are explained by the stolen bases).
- Christian Yelich looks to be the most over-valued player in the top 20, with people selecting him 5th even though his value looks to be 13th. The most over valued player overall is J.D. Martinez who ranks 33rd in Fantasy WAR, but is being drafted 4th among position players.
Deficiencies In Fantasy WAR
Please do not use this list as your draft cheat sheet and then yell at me when your team is terrible. There are several key things that Fantasy WAR and/or my calculation of it are bad predictors of:
- Billy Beane is famous for his quote, “My shit doesn’t work in the playoffs”. Neither would Fantasy WAR. A team selected based only on Fantasy WAR would be designed to beat the average team. It would be likely to rack up wins in the regular season, but may not stack up well against a team that has several categories very well covered. I would expect a team built on Fantasy WAR to do really well at racking up wins against bad teams but may lose 7-5 in the playoffs without making any of the 7 particularly close.
- I ignored positions for this calculation. There were a number of reasons I chose to do this; the two utility players, the daily switching of lineups, the fact that center fielders aren’t treated separately. That said, obviously the catcher position as well as probably middle infield spots need to be given special attention. Unless I missed something, the most valuable catcher is JT Realmuto at 113th!
- The values listed here are only really useful for your first pick. Once you already have Trea Turner and his 41 steals on your team, Mondesi isn’t nearly as likely to win you games. For this purpose, I intend to make a version of this spreadsheet for my draft where I can ignore certain categories once I have “enough” of them on the team.
If you look through this and spot something you think I missed, feel free to comment.